 Two scientists performing science. from the-scientist.com, July 2011
I just got back from the annual meeting of the Society for the Improvement of Psychological Science (SIPS) and had a great time talking to a number of psychologists looking to help promote open, reproducible science. It really got me thinking about all the different kinds of science I’ve been a part of in my undergraduate and graduate career.
For a very long time I was a cellular biologist. The most productive time of my tenure as a biologist was when I was studying Immunology. Immunology is the study of the immune system, which is a disparate organ system comprised of organs (spleen, thymus, lymph nodes) and white blood cells spread throughout the body. A big chunk of immunological research involves identifying different cell populations and how they react to different treatments.
For example, do the CD8+ T cells (which are a type of white blood cell) of a Type I diabetic person activate more strongly than those from a non-diabetic? In this case, blood would be taken from Type I diabetic and non-diabetic participants, and the blood cells would be treated to an in vitro stimulation. Then, the cells would be observed for their activation.
But how can one observe the activation of these cells? This is where a special type of measurement tool comes in: the flow cytometer. Flow cytometry is a process that allows a research to “scan” individual cells for surface receptors or proteins of interest. These can be used to identify specific cell populations. Cells that have a T Cell Receptor (TCR) and the CD3 surface protein are different than those that have a TCR, CD3, and the CD4 surface protein. By making scatter plots like the one below (where one axis is the CD3 protein and the other axis is the CD4 protein), researchers can identify cell populations of interest.
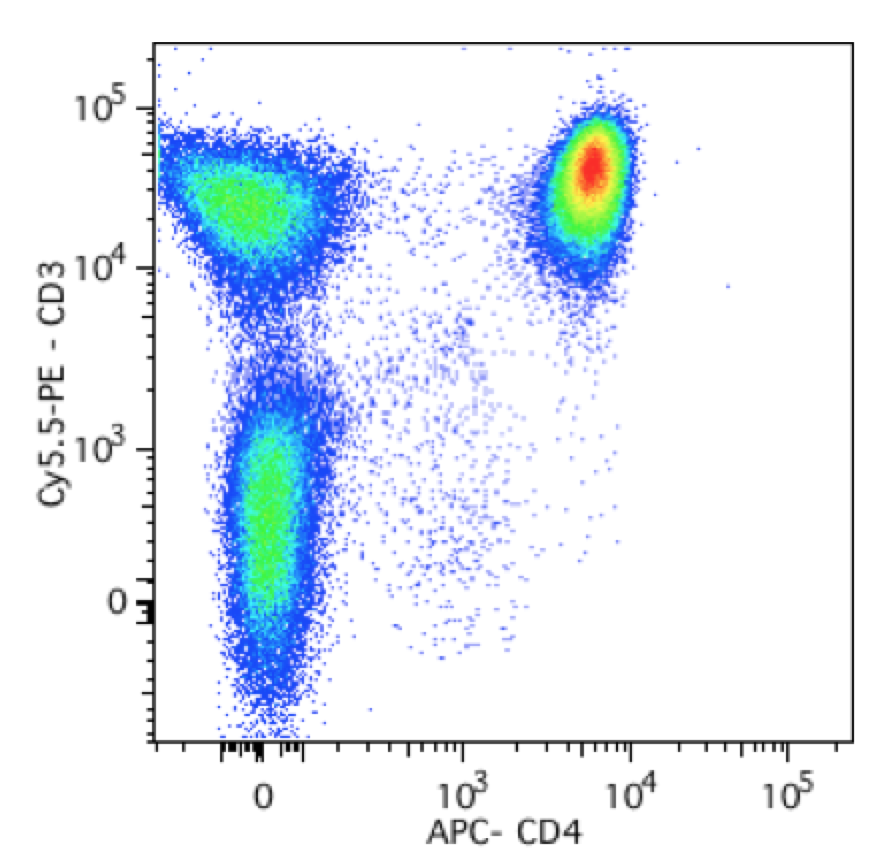
Let’s say you are only interested in cells that are expressing CD3 but not expressing CD4. You may want to further explore the characteristics of this population (for example, maybe you want to see if they are more activated in Type 1 diabetics compared to non-diabetics). How do you select only this population? You could use some method of k-means clustering or k-nearest neighbors…or you could just draw a box around it.
That is what immunologists do. Sometimes it is an oval, or a static set of quadrants. The problem with this is the researcher’s degrees of freedom. When the researcher eyeballs what cells are the cells that will be chosen for analysis, that cannot be replicated by someone else. What are the odds two people will draw the exact same box given the exact same data when they’re using a manual selection tool?
Here is an example of when this can throw results into question:
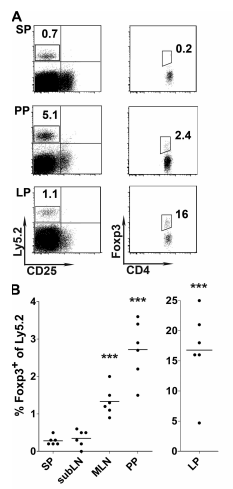
On top are 3 sets of flow cytometry scatter plots, showing a comparison of the percent of cells that are CD25- (they don’t have that protein), Ly5.2+, CD4+, FoxP3+. This is a particular type of immune cell, and the point from this figure is that there are more of this cell type in the lamina propria (LP) and few in Peyer’s patches (PP) and the spleen (SP). The bottom shows the average percent for each of 6 mice per group (each point represents the percent of FoxP3+ cells per animal in the CD25-, Ly5.2+, CD4+ population(the boxed areas from the top)).
I was curious if they were using the same boxes to inscribe these populations, so I stacked two of them on top of each other. Here is the result:
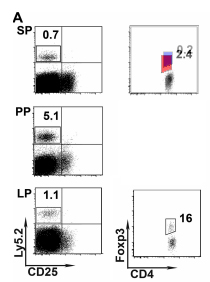
Unfortunately, this paper does not describe the decision making process in generating these selection boxes for these cell populations. They also did not indicate how many cells were collected from each animal, nor publish the scatter plots for the other 5 animals per each group. An obvious problem from this approach is selection bias. Researchers select the most obvious grouping of cells given the density plot. Whether or not this is the most correct approach is not accounted for, and many cells of interest may be lost because they did not fall perfectly with other cells.
But there is an additional issue with this type of data analysis. Each animal has a certain number of cells collected. This number is not reported and can vary by thousands of cells between animals. A percentage is calculated as “positive” for a certain phenotype (x% of cells are positive for this phenotype, and 1-x% of cells are negative). Depending on the phenotype, your population of interest may have already been subjected to several rounds of selection via hand-drawn selection boxes. In the end, there are only two possible states for a cell: either positive or negative - this is a binary outcome. A percentage of positive cells is calculated, and those percentages are averaged across animals by condition (see the bottom panel of the figure above). Those conditions are then compared via t test (as reported in the methods section).
There is an problem with nesting here - the cells being collected and measured are nested within animal. For animals who have fewer cells collected, each individual cell will carry more weight when falling as either phenotype positive or phenotype negative. In other words, in an animal with 5,000 cells collected, each cell that is positive will increase the animal’s percent positive to a higher magnitude than an animal with 10,000 cells collected. This problem is compounded the further down into hand-drawn population selections you get: at each step, cell population differences between animals may increase or decrease depending on how those selection boxes are drawn by the researcher.
One solution would be to control for this variation using multi-level or hierarchal linear models. This would help account for the differences in cell counts between animals. Some animals may have fewer cells collected for a variety of reasons, though that should not afford their phenotypes increased weight in the final analysis.
Another solution is to use clustering analysis to identify cell populations. Doing this removes a degree of freedom from the researcher, which is especially important when cell populations may be relatively close together on a given axis. This also gives more power to others looking to replicate findings: On a different machine with a different technician, populations may look different, and having an analytic approach that is robust to variation across observer is important for reproducibility.
Finally, it is important to note that this approach to data collection is extremely common and widespread. I did a quick search of “FoxP3” on google scholar and many papers had published flow cytometry with questionable approaches to population selection and mean group comparisons. For immunology to progress in this time of increased scrutiny of data prep, analysis, and reproduction, the field will need to reexamine its relationship with flow cytometry and generate new, robust protocols.
(black and white figure from:
Small intestine lamina propria dendritic cells promote de novo generation of Foxp3 T reg cells via retinoic acid. Cheng-Ming Sun, Jason A. Hall, Rebecca B. Blank, Nicolas Bouladoux, Mohamed Oukka, J. Rodrigo Mora, Yasmine Belkaid. Journal of Experimental Medicine Aug 2007, 204 (8) 1775–1785; DOI: 10.1084/jem.20070602)